
 EN
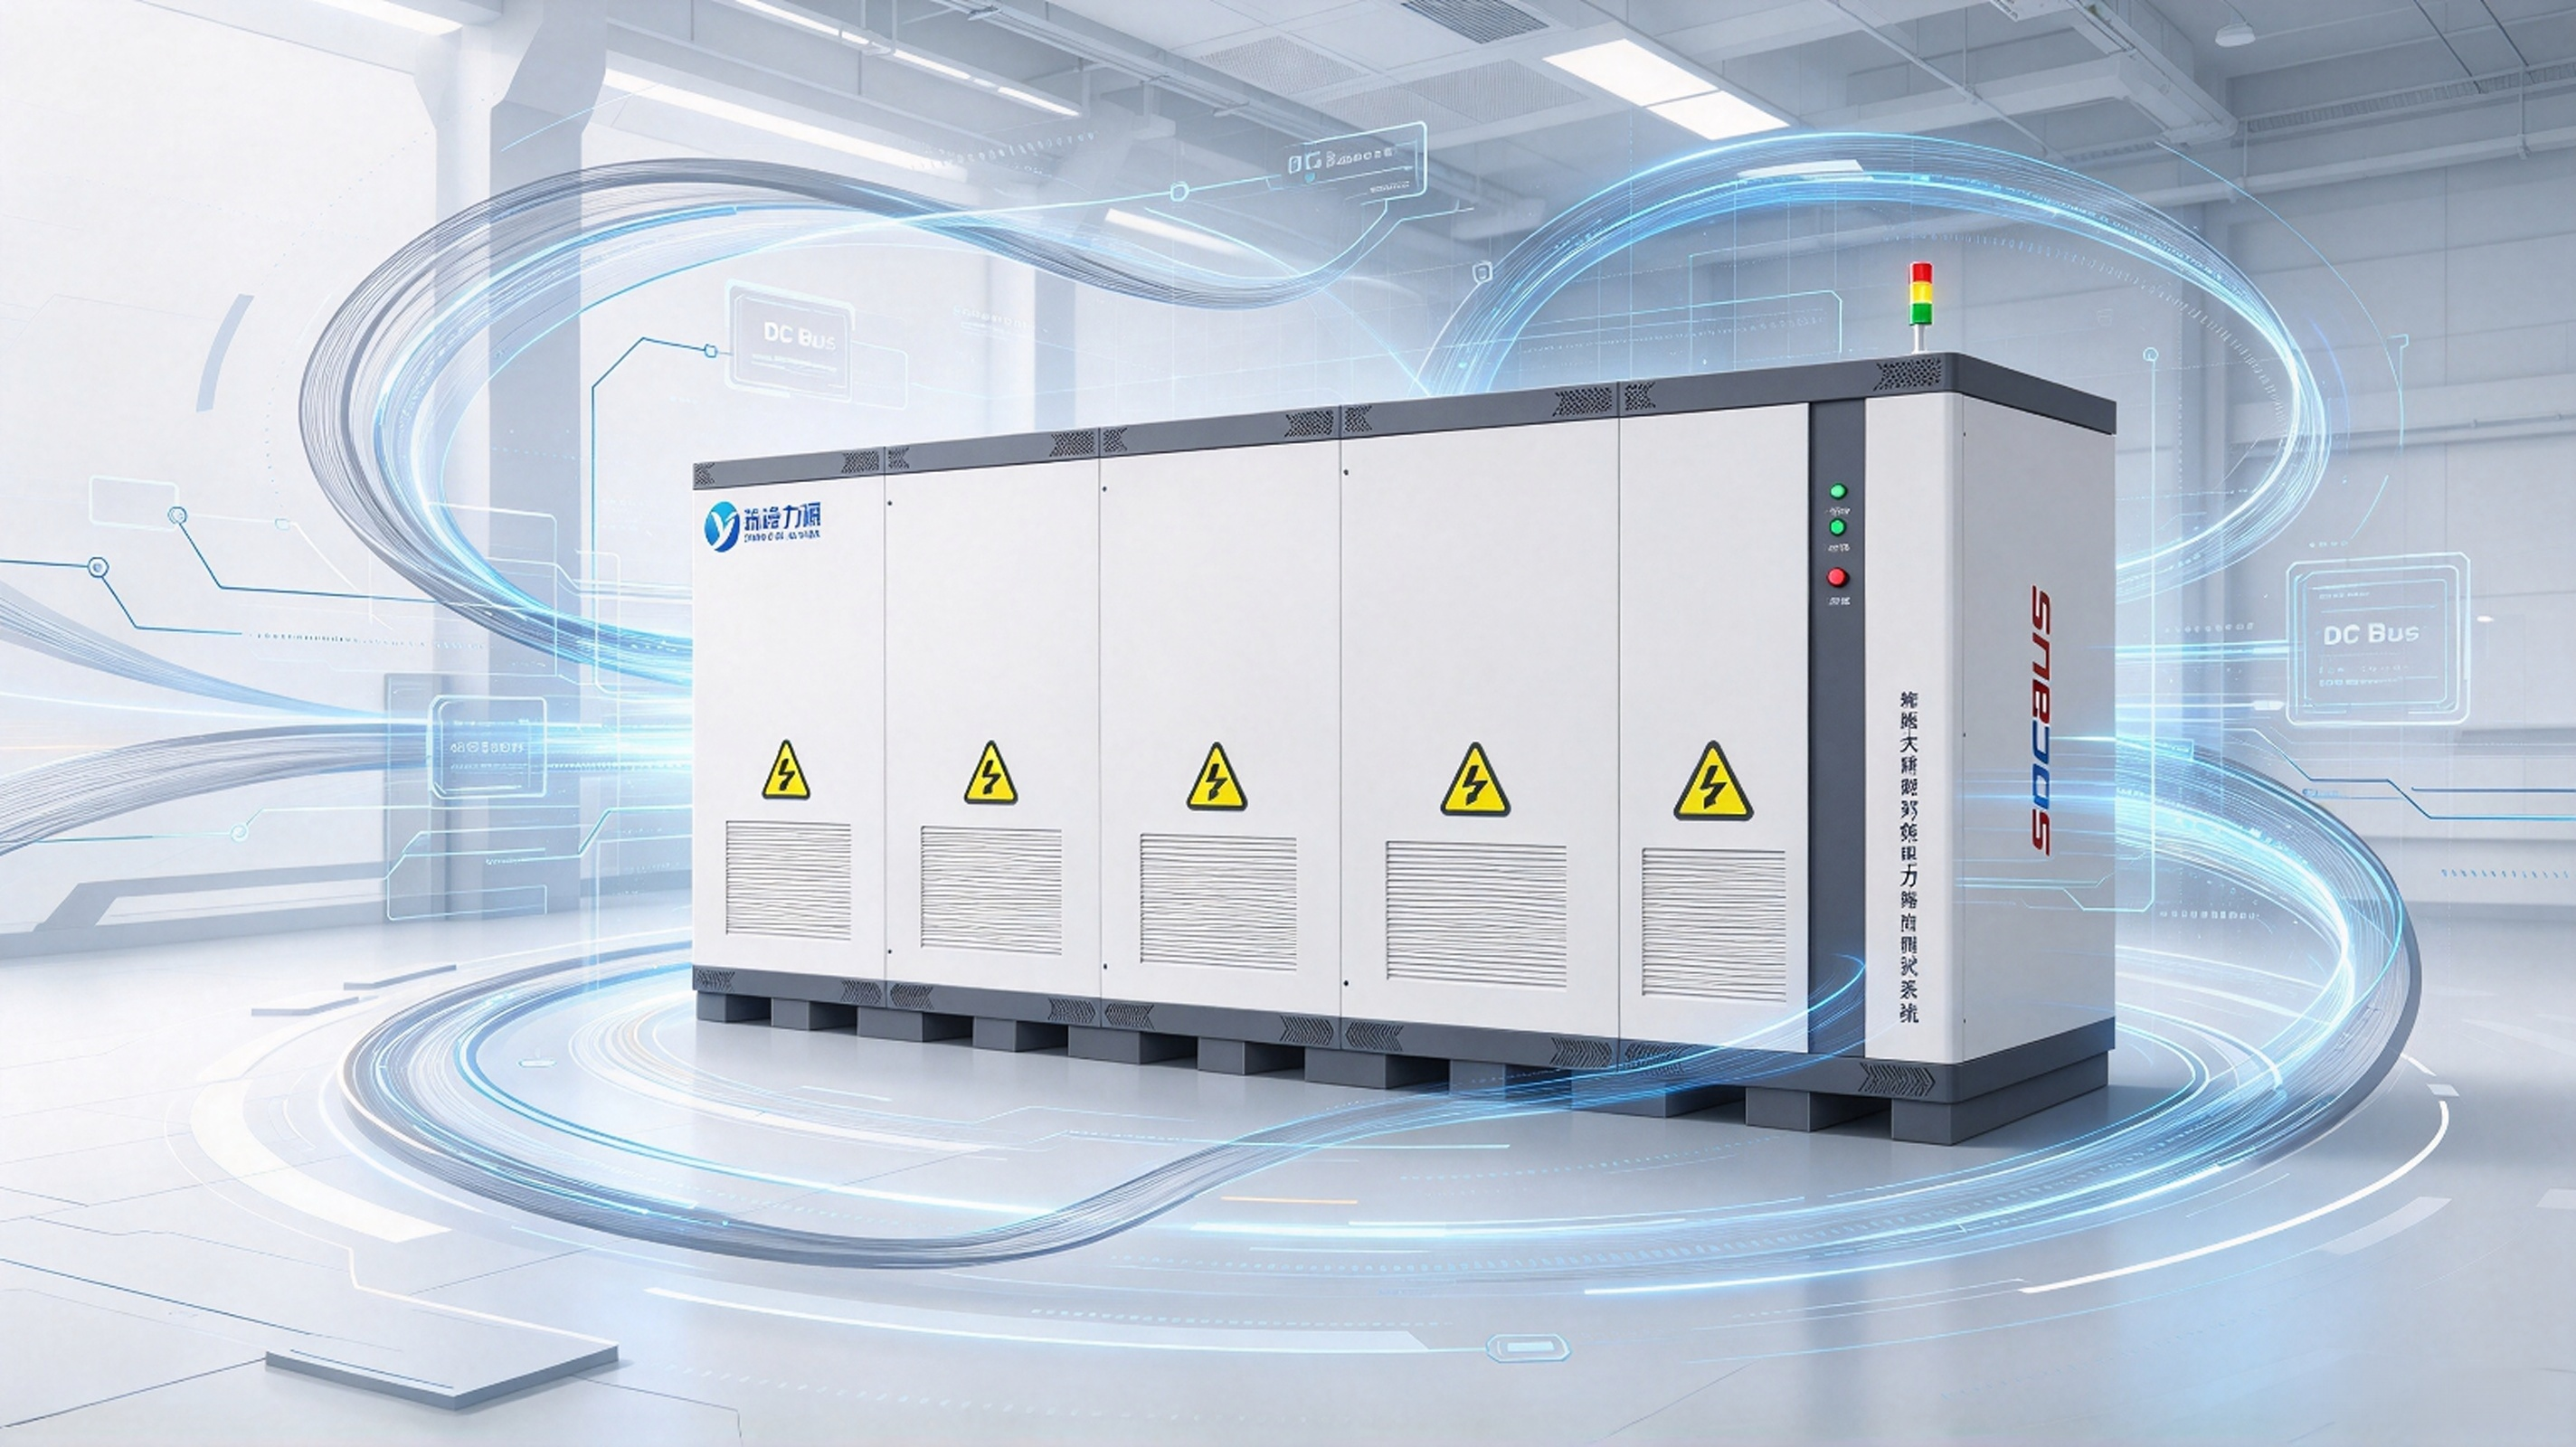
LFP Battery Testing for Energy Storage: Avoid Costly Mistakes in BESS Qualification
A practical guide for BESS engineers, cell manufacturers, and procurement teams
Quick takeaway for busy readers: Validating long‑life LFP energy‑storage cells can take multiple years with conventional test workflows. Reusing EV battery test protocols is a common, costly mistake. Stationary storage suffers heavily from calendar ageing, float‑charge stress and shallow‑cycle failure modes. This article covers 4‑level hierarchical testing, robust cycle‑life protocol design, global market‑specific standards, early‑warning degradation metrics, and back‑to‑back energy‑circulation test systems that slash megawatt‑scale test electricity costs by ~98 %.
Why LFP Dominates Stationary Energy Storage
Lithium‑iron‑phosphate (LFP / LiFePO₄) accounts for the vast majority of newly‑installed stationary energy‑storage capacity globally. Its market leadership stems from fundamental material advantages, not temporary market trends.
-
Superior thermal stability
The olivine crystal structure of LiFePO₄ is reinforced by strong PO chemical bonds. Thermal‑runaway onset for LFP cells typically exceeds 270 °C — far higher than NMC or NCA lithium‑ion chemistries. For containerised BESS deployed beside substations or inside industrial facilities, this large safety margin lowers fire risks, simplifies permitting and reduces insurance premiums for energy‑storage assets.
-
Long cycle life
Modern ESS‑grade LFP cells deliver 6 000‑12 000 cycles to 80 % capacity retention. Under equivalent stationary‑storage operating conditions, this is 2‑4× the cycle performance of most high‑nickel lithium‑ion cells.
-
Flat discharge voltage plateau
LFP has a nominal voltage of ~3.2 V with an extremely flat discharge curve. This simplifies state‑of‑charge (SOC) estimation and enables predictable BMS balancing behaviour — critical when managing strings of 400+ series‑connected cells inside BESS racks.
-
Favourable cost & raw‑material supply chain
LFP contains no cobalt or nickel. It delivers lower, more stable raw‑material costs and significantly reduces exposure to global supply‑chain bottlenecks.
-
Strong calendar‑ageing performance
For stationary‑storage projects, calendar ageing (time‑driven degradation) often imposes harder limits than cycle ageing. LFP degrades more slowly under float‑charge conditions and high‑temperature storage compared with high‑nickel cell chemistries.
Important note: All five performance benefits remain theoretical without proper validation testing. EV‑oriented LFP test workflows cannot be directly reused for stationary energy‑storage applications.
ESS vs EV Duty Cycles: Critical Differences
One of the most frequent mistakes in LFP test‑program design is repurposing EV battery test protocols for stationary‑storage cells. Electric‑vehicle and grid‑scale storage stress battery cells in fundamentally different ways.
| Dimension | EV (Motive Application) | ESS (Stationary Storage) |
|---|---|---|
| Cycle depth | Deep cycles: 80‑100 % DOD | Mostly shallow‑to‑medium depth: 50‑90 % DOD |
| Operating C‑rate | High‑power, frequent fast‑charging | Moderate rates: typically 0.25‑0.5 C |
| Duty‑cycle pattern | Irregular, driver‑dependent | Repetitive, grid‑signal‑driven |
| Primary ageing mode | Cycle‑dominated ageing | Calendar ageing + float‑charge stress |
| Operating temperature | Ambient with short thermal spikes | Sustained elevated temperature inside BESS containers |
| Design‑life target | 8‑10 years; 1 000‑2 000 cycles | 15‑25 years; 6 000‑12 000 cycles |
| Rest conditions | Frequent rest periods at partial SOC | Long float‑hold periods at high SOC |
Three practical test consequences
-
Calendar ageing outweighs pure cycle ageing
ESS cells spend most of their service life sitting at partial SOC under constant float voltage inside containers running 25‑40 °C. Test protocols relying purely on aggressive repeated cycling will systematically overpredict real‑world service lifetime.
-
Dedicated float‑stress & high‑SOC testing is mandatory
Long‑term holding at 100 % SOC accelerates electrolyte oxidation and irreversible lithium‑inventory loss. This capacity fade accumulates during rest periods, not during charge‑discharge cycling — and will never appear in cycle‑only test campaigns.
-
Shallow cycling creates non‑intuitive failure signatures
Cells cycled at 50 % DOD may show negligible capacity fade for thousands of cycles before sudden catastrophic performance drop‑off. Hidden lithium‑inventory loss builds gradually until electrode balance collapses.
Capacity reading alone is a lagging indicator. Continuously log coulombic efficiency and DC internal resistance (DCIR) throughout your test campaign. If you only measure capacity every 100 cycles, you will spot symptoms months after degradation mechanisms have already started.
Four‑Level LFP Battery‑Testing Framework for Energy‑Storage Systems
ESS LFP validation follows four distinct test levels. Each level has unique objectives, pass‑fail criteria and vastly different test‑equipment requirements.
![lfp‑battery‑testing‑map‑ess.webp].png](https://shopcdnalpha.grainajz.com/category/462964/3826/3045f742d40bdbbc95751c4afeb81fc3/lfp%E2%80%91battery%E2%80%91testing%E2%80%91map%E2%80%91ess.webp%5D.png)
-
Level 1 — Cell‑level testing
Tasks: Capacity grading & sorting, DCIR / ACIR measurement, EIS (10 mHz‑100 kHz), full‑rated cycle‑life validation, abuse‑safety testing for transport & market certification.
This stage establishes baseline performance for all higher‑level assembly tests. Cell‑level testers operate at hundreds of watts per channel; statistical sample size takes priority over ultra‑high power.
-
Level 2 — Module‑level testing
Tasks: Inter‑cell voltage balance (typically ΔV < 50 mV under load), module thermal uniformity (ΔT < 5 °C across module), BMS communication handshake & protection‑logic verification, UN 38.3 vibration & mechanical shock, insulation‑resistance testing.
Channel power increases to the kilowatt range for module‑level testing.
-
Level 3 — Rack‑level testing
Tasks: Parallel circulating‑current verification across series strings, thermal mapping under sustained operating load, insulation integrity at full string voltage, site‑controller protocol & communication validation, extended float‑soak testing (typically ≥384 hours continuous monitoring).
Test voltages reach 1 000‑1 500 V DC; power scales to tens‑to‑hundreds of kilowatts.
-
Level 4 — Full‑system & container‑level testing
Tasks: UL 9540A thermal‑runaway propagation testing, round‑trip‑efficiency characterisation, grid‑support‑function validation (frequency response, peak shaving, island‑mode operation), site‑commissioning validation, long‑term state‑of‑health tracking.
Container‑scale testing runs at megawatt power levels with multi‑year test timelines.
Test‑system power requirements scale roughly three orders of magnitude from cell‑level through container‑system testing. This large hardware jump makes test‑lab economics a core engineering consideration, not an afterthought.
Global LFP‑ESS Test Standards by Market
Different geographic markets enforce distinct safety & performance standards for stationary LFP battery energy‑storage systems. Align your test plan with target‑market requirements before starting product certification.
North America
- UL 9540: Primary safety standard for energy‑storage systems & equipment
- UL 9540A: Mandatory thermal‑runaway‑propagation fire test for rack‑ and container‑level BESS
- UN 38.3: Transport‑safety qualification for individual cells and modules for shipping
European Union
- IEC 62619: Safety requirements for lithium‑ion cells & batteries used in stationary applications
- IEC 63056: Performance and cycle‑life testing standard for stationary energy‑storage batteries
- EN 62477‑1: Safety requirements for power‑converter equipment inside BESS
Australia & New Zealand
- AS/NZS 5139: Safety standard for stationary lithium‑ion battery energy‑storage systems
Global transport requirement
- UN 38.3: Cell / module vibration, thermal, shock, altitude and overcharge‑abuse testing for cross‑border shipment, required for nearly all regions.
Note: Standards define minimum test conditions. Beyond compliance testing, real‑world field‑duty‑cycle profile testing is strongly recommended to validate 15‑25‑year asset lifetime.
Build a Robust Cycle‑Life Test Protocol for BESS Qualification
Cycle‑life metrics are core contractual KPIs your customers will hold you accountable for. Give careful attention to protocol design.
-
Fully define performance claims upfront
A “6 000‑cycle” rating means nothing without complete operating conditions. Credible datasheet specifications must include: depth of discharge (DOD), charge / discharge C‑rate, ambient temperature, and end‑of‑life capacity threshold.
Example: A cell rated 6 000 cycles @100 % DOD, 25 °C is a completely different product versus one rated 6 000 cycles @80 % DOD, 35 °C.
-
Select standard cycling, profile cycling — or ideally both
- Standard cycling (constant‑current, fixed‑DOD): Produces clean, repeatable ageing curves for direct datasheet comparison.
- Profile cycling: Replays real‑world grid operating profiles: solar shift, frequency regulation, peak‑shaving workloads. Reveals actual field performance.
If lab resources are limited, prioritise profile cycling. If capacity allows, run standard cycling as a reference baseline alongside real‑world profile testing.
-
Insert Reference Performance Tests (RPT) at fixed intervals
Every 100‑200 cycles, pause long‑term cycling and run comprehensive cell characterisation: low‑rate capacity check, DCIR measurement, HPPC pulse testing.
Without periodic RPTs you only obtain one final end‑of‑test result. RPT datasets capture the full degradation trajectory and enable remaining‑life prediction, instead of only documenting failure after it occurs.
-
Monitor for the “knee point” in degradation curves
Many LFP cells exhibit near‑linear degradation for thousands of cycles, followed by sharp accelerated ageing. This inflection “knee point” marks the transition from gradual lithium‑inventory loss to electrode saturation. Early detection of this knee informs warranty‑limit definition.
-
Interpret accelerated‑ageing results cautiously
Raising temperature by 10 °C roughly doubles chemical‑reaction rates, yet this Arrhenius relationship is not universal for LFP. Higher temperatures disproportionately amplify specific degradation pathways. Temperature‑accelerated extrapolation may either over‑ or under‑predict real‑world calendar / cycle life.
Use accelerated ageing to rank‑compare multiple cell candidates. Never rely purely on accelerated tests to certify absolute cycle‑life figures.
Key Electrical & Electrochemical Metrics for LFP Storage‑Cell Health
Beyond simple capacity readings, these measurements diagnose real‑world cell degradation for stationary‑storage applications.
| Measurement | What it reveals | Typical reference benchmark |
|---|---|---|
| Capacity | Available energy; cell‑to‑cell performance spread | Production batch variance ±2 % |
| DCIR | Ohmic + polarisation resistance under real load | Stable in early life; upward trend signals degradation |
| ACIR | Fixed‑frequency impedance | Fast production‑screening proxy for DCIR |
| HPPC | Pulse‑power capability across full SOC window | Used to build power‑vs‑SOC operating maps |
| EIS | Charge‑transfer & diffusion impedance | 10 mHz‑100 kHz sweep; mid‑frequency arc growth correlates with ageing |
| Coulombic efficiency | Parasitic side‑reactions per cycle | >99.5 % for healthy LFP; drop acts as early‑fade warning |
| Round‑trip energy efficiency | Total charge‑discharge system losses | ≥90 % for cell / module level |
| Self‑discharge | Parasitic leakage, soft‑short detection | <3 % per month @25 °C |
Two high‑priority metrics
-
Coulombic efficiency is your earliest degradation‑warning signal
A cell suffering lithium‑inventory loss can still deliver near‑rated capacity for hundreds of cycles. However, coulombic efficiency will drift below 99.5 % long before capacity drops noticeably. Only tracking capacity makes you miss early‑stage failure precursors.
-
EIS is a diagnostic tool, not high‑volume production screening
Full EIS frequency sweeps take minutes and pinpoint root‑cause degradation: ohmic loss, charge‑transfer resistance or diffusion limitations. Use EIS for failure analysis. For mass screening, use single‑frequency ACIR instead.
Back‑to‑Back Energy‑Circulation Testing: Transform Large‑Scale Test‑Lab Economics
Starting at rack level and above, your test‑system architecture defines total‑cost‑of‑ownership.
Traditional charge‑discharge test systems draw grid power for battery charging, then dissipate discharge energy as heat through resistive‑load banks. Alternative grid‑feedback setups suffer double‑sided AC‑DC conversion losses. Every MWh cycled consumes grid electricity and generates waste heat requiring cooling.
Back‑to‑back energy‑circulation testing eliminates resistive‑load banks entirely. Two battery compartments share a common DC bus. When Compartment 1 discharges, its energy directly charges Compartment 2. Test direction reverses cyclically. The grid only supplies small amounts of power to compensate for system conversion losses.
![back-to-back-test-system-topology.webp].png](https://shopcdnalpha.grainajz.com/category/462964/3826/1c155c09004753275f5f078ff68bc7b0/back-to-back-test-system-topology.webp%5D.png)
Two core architectural advantages
- Shared common DC bus minimises transmission losses; energy transfers between compartments without returning to AC mains, avoiding repeated AC‑DC conversion penalty.
- Bidirectional grid‑side AC/DC hardware supports all charge‑discharge test modes without separate standalone charger and resistive‑load hardware.
Additional key benefits of back‑to‑back energy‑circulation architecture
-
High precision at megawatt scale
Systems delivering ±2 500 A per channel with accuracy of ±(0.05 % FS + 0.05 % RD) maintain high measurement fidelity even under full‑power container‑scale testing. High‑precision metering is built‑in by design, not added as an afterthought.
-
Smaller footprint & quieter lab installation
No large resistive‑load banks means no dedicated load‑bank cooling systems, no extreme heat exhaust and no special firewall separation. A typical container‑grade test‑system reaches ≤75 dB noise at 1 m distance. IP21‑rated cabinets occupy metre‑scale floor‑space instead of sprawling multi‑tens‑of‑metre layouts.
-
Full‑process test traceability
≤10 ms continuous sampling rate, automatic logging and end‑to‑end audit‑ready data traceability for multi‑month qualification campaigns. Without traceable datasets, test results carry limited validity for certification.
-
Long service‑life matching energy‑storage assets
25‑year design service‑life for test hardware aligns with the target lifetime of BESS products under qualification. You avoid mid‑product‑generation test‑system replacement costs.
-
Multifunction unified platform
Capacity testing, charge‑discharge characterisation, efficiency mapping, cycle‑life ageing, thermal‑characterisation and real‑world operating‑profile simulation all run on one unified hardware platform instead of multiple disjointed test setups.
For storage manufacturers and independent test labs running continuous qualification projects, energy‑circulation back‑to‑back systems typically achieve payback within months. After breakeven, every subsequent test campaign delivers pure operating‑cost savings.
Working on megawatt‑scale BESS qualification? Our MatrixLinkPST series cuts your long‑term cycling electricity costs dramatically. Contact our engineering team.
Final Conclusions
LFP battery testing for energy storage cannot be treated as “scaled‑up automotive battery testing”. LFP’s dominant failure modes — calendar ageing, float‑charge stress, hidden lithium‑inventory loss — are often invisible to conventional deep‑cycle test schedules built for EVs.
Three core takeaways for your BESS‑qualification workflow:
-
Test for real‑world operating duty cycles
Profile‑based cycling, extended float‑soak testing and continuous coulombic‑efficiency monitoring deliver far better insight into 15+‑year field lifetime than accelerated deep‑cycle testing alone.
-
Track degradation precursors; do not only monitor capacity
DCIR and coulombic efficiency shift well before measurable capacity fade. Configure test campaigns to catch degradation knee‑points proactively, rather than observing failure after it occurs.
-
Prioritise energy‑handling efficiency for rack‑ and container‑scale testing
At container‑system scale, electricity consumed during testing is often your single‑largest test‑budget line‑item. Back‑to‑back internal‑energy‑circulation test‑systems cut energy consumption by ~98 % while preserving megawatt‑class measurement precision, delivering fast return‑on‑investment for qualification labs.
A 280 Ah LFP cell rated for 12 000 cycles takes more than two years to finish full validation under continuous test schedules. Hardly any project can afford a two‑year wait. This practical constraint shapes nearly every decision for energy‑storage battery testing: which test items to prioritise, how to run accelerated‑ageing tests, how many test channels you require, and how much electricity you consume during long‑term cycling.
Need support designing your BESS qualification test setup? Talk to our engineers for system sizing tailored to your real‑world duty‑cycle profiles.
FAQ
Q1: Why are EV battery test protocols not suitable for energy‑storage LFP cells?
A: ESS faces long float‑charge periods, shallow‑to‑medium DOD cycles and calendar‑dominated ageing. EV testing focuses on deep fast cycles and cycle‑induced ageing only. Using EV protocols will overestimate real‑world BESS service life.
Q2: What is back‑to‑back energy‑circulation battery testing?
A: Back‑to‑back testing circulates energy between two battery compartments via a shared DC bus. The grid only supplies power to cover conversion losses. It drastically cuts electricity consumption for long‑duration megawatt‑scale BESS qualification testing.
Q3: What key metrics indicate early LFP cell degradation before capacity drops?
A: Coulombic‑efficiency drop and rising DCIR are leading early‑warning indicators, long before obvious capacity fade appears.
Q4: What is float‑soak testing for LFP ESS?
A: A float‑soak test holds batteries at fixed high‑SOC and constant temperature for hundreds of hours. It replicates real‑world stationary‑storage float‑charge conditions to evaluate calendar ageing and electrolyte‑related degradation.
Q5: What is RPT (Reference Performance Test) in battery cycling?
A: RPT is a periodic full‑characterisation test executed by pausing long‑term cycle‑ageing campaigns. It measures capacity, DCIR and pulse performance, capturing the full degradation trajectory instead of only final‑end‑of‑test data.
Q6: What causes the knee‑point degradation on LFP ageing curves?
A: The knee point marks the transition from slow, gradual lithium‑inventory loss to accelerated degradation. Hidden lithium loss accumulates over cycles until electrode balance collapses, triggering sharp capacity drop‑off.
Q7: Which standards apply for LFP BESS testing in North America / EU?
A: North America follows UL 9540 / UL 9540A; EU uses IEC 62619 and IEC 63056. UN 38.3 is a global transport‑safety requirement for cells and modules.
Table of Contents
- LFP Battery Testing for Energy Storage: Avoid Costly Mistakes in BESS Qualification
- Why LFP Dominates Stationary Energy Storage
- ESS vs EV Duty Cycles: Critical Differences
- Four‑Level LFP Battery‑Testing Framework for Energy‑Storage Systems
- Global LFP‑ESS Test Standards by Market
- Build a Robust Cycle‑Life Test Protocol for BESS Qualification
- Key Electrical & Electrochemical Metrics for LFP Storage‑Cell Health
- Back‑to‑Back Energy‑Circulation Testing: Transform Large‑Scale Test‑Lab Economics
- Final Conclusions
- FAQ